Last year, I made a purchase of four Air Quality Monitors for around the house; one per floor (including the basement, since we have those in my area), along with one monitor for the outside. The reason I wanted to purchase Air Quality Monitors initially stemmed from the Canadian Wild Fires in 2012, which led to the air quality in my part of the United States becoming dangerously unhealthy. For a few weeks, we had a cloud of smoke blanketing our skies, creating a haze, and producing some rather spectacularly eerie sunrises and sunsets. Even on clear, sunny days, the skies had a distinct light gray look to them. On cloudy days, you couldn’t see the clouds. On stormy days, you couldn’t see approaching thunderstorms, until the storm was right on top of you. For one or two days, the smoke layer would blow down to the ground, sending the Air Quality Index from the normal <20 AQI range, to the 160+ AQI range, and cause otherwise healthy people around my area to call of of work due to feeling unwell.
In 2022 and in 2023, wild fires in Canada once again occurred, and once again, the air quality in my area quickly went sour. In 2023, the fires were much closer, and the days where atmospheric conditions would blow smoke down from the upper atmosphere, meant that we had around 1,000-2,000ft of visibility at best. The smoke looked like a heavy fog, and made driving at night particularly worse than a typical foggy evening. Once again, people became sick in the area. The timing couldn’t have been worse, as we were also dealing with a hyper-active pollen/allergy season caused by not having a proper winter. A thick layer of pollen on my car was combined with a disgusting layer of smoke, and acting a bit like the cigarette tar that I find inside of a smoker’s computer. That can’t be good to breathe in.
So about not being able to see storms approaching… here’s a few photos from 2021 when we dealt with the wild fire smoke for a few weeks. This was on a day where the US Air Quality Index was 188 at the maximum. The normal Air Quality Index for my area is typically around 2-14.
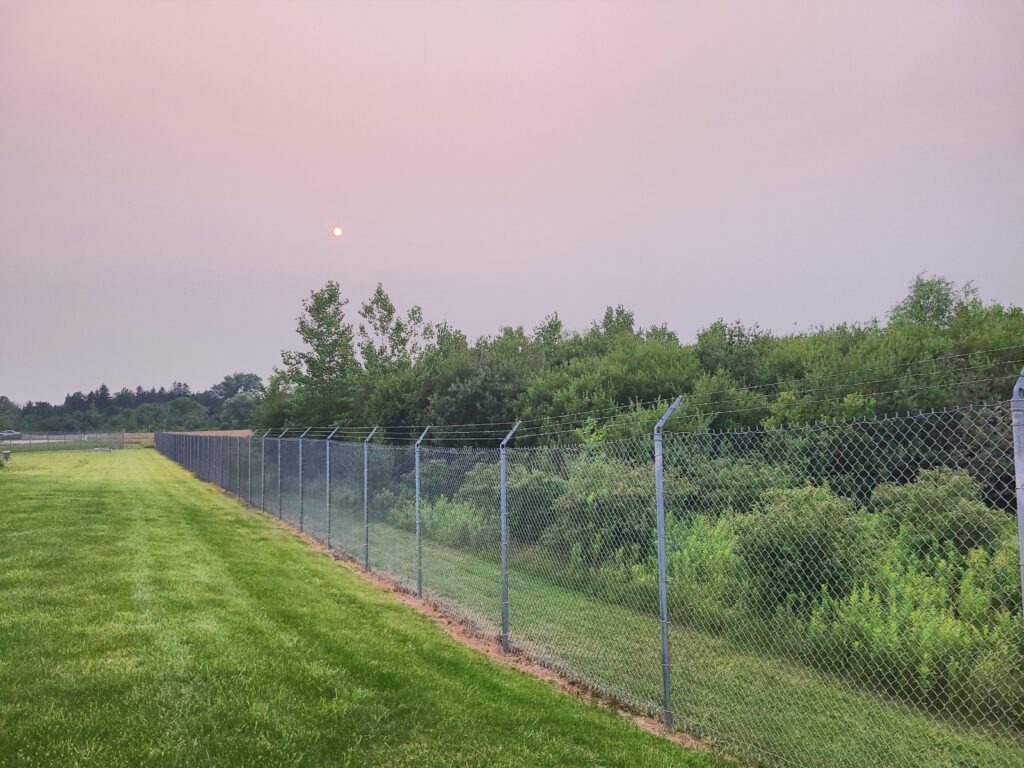
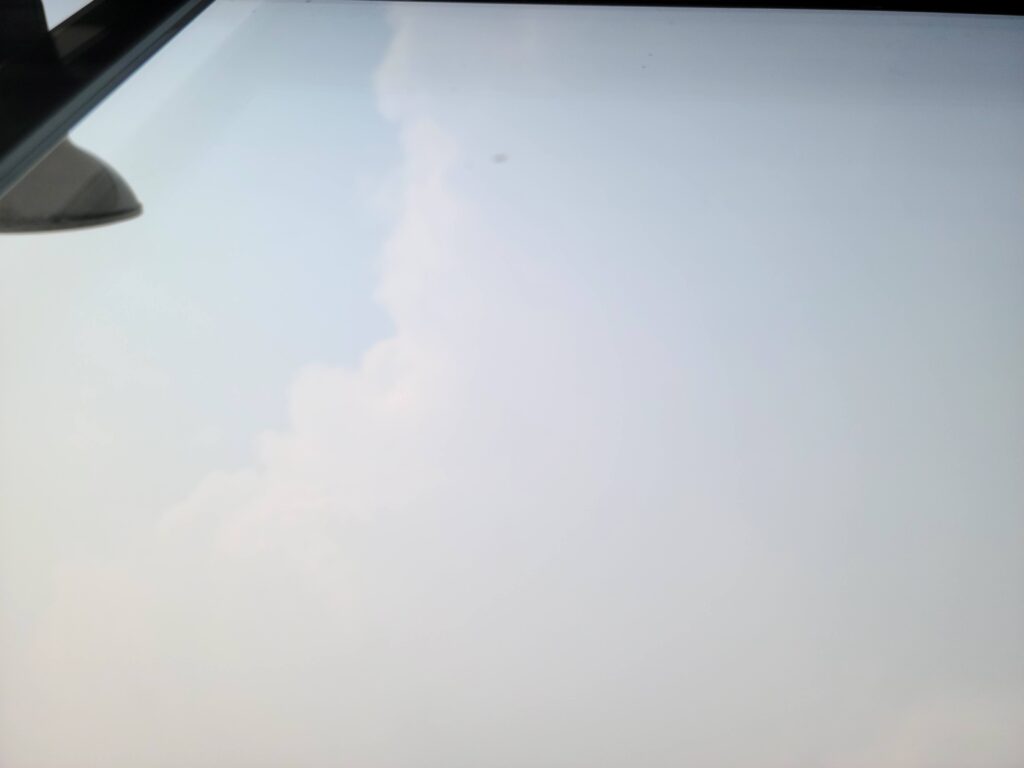


Anyways. Hopefully those photos give an idea of why poor air quality is bad from a safety perspective. Normal people becoming sick due to poor air isn’t good. People with health conditions or asthma who are already sensitive to changes in air quality, are certainly not being helped here. The wild fire smoke has also been a notable cause of shorter lifespans. With reports about half of all Americans (and on a global scale, a huge portion of the world) being exposed to “unsafe” levels of pollutants, the urge to get an air quality monitor for myself presented itself.
During the smoke weather events I mentioned above, I was using near real-time data from a company called PurpleAir, a manufacturer of Air Quality Monitors focused on temperature, humidity, and PM2.5 measurements. PurpleAir makes respectable Air Quality Monitors which measure the most harmful pollutant category, PM2.5, along with Humidity and Temperature. Their sensors feature a dual sensor configuration allowing for a high degree of confidence in the measurements. Setup of the monitors is pretty straight forward, and is a matter of connecting to the device’s hotspot, accessing a web page on the device, connecting the hardware to Wi-Fi, and then associating the product to an account on the PurpleAir service.
But this post is about the AirGradient Monitors, right? Why did I go with the AirGradient monitors instead of a PurpleAir?
Introducing the AirGradient One, and AirGradient Open Air
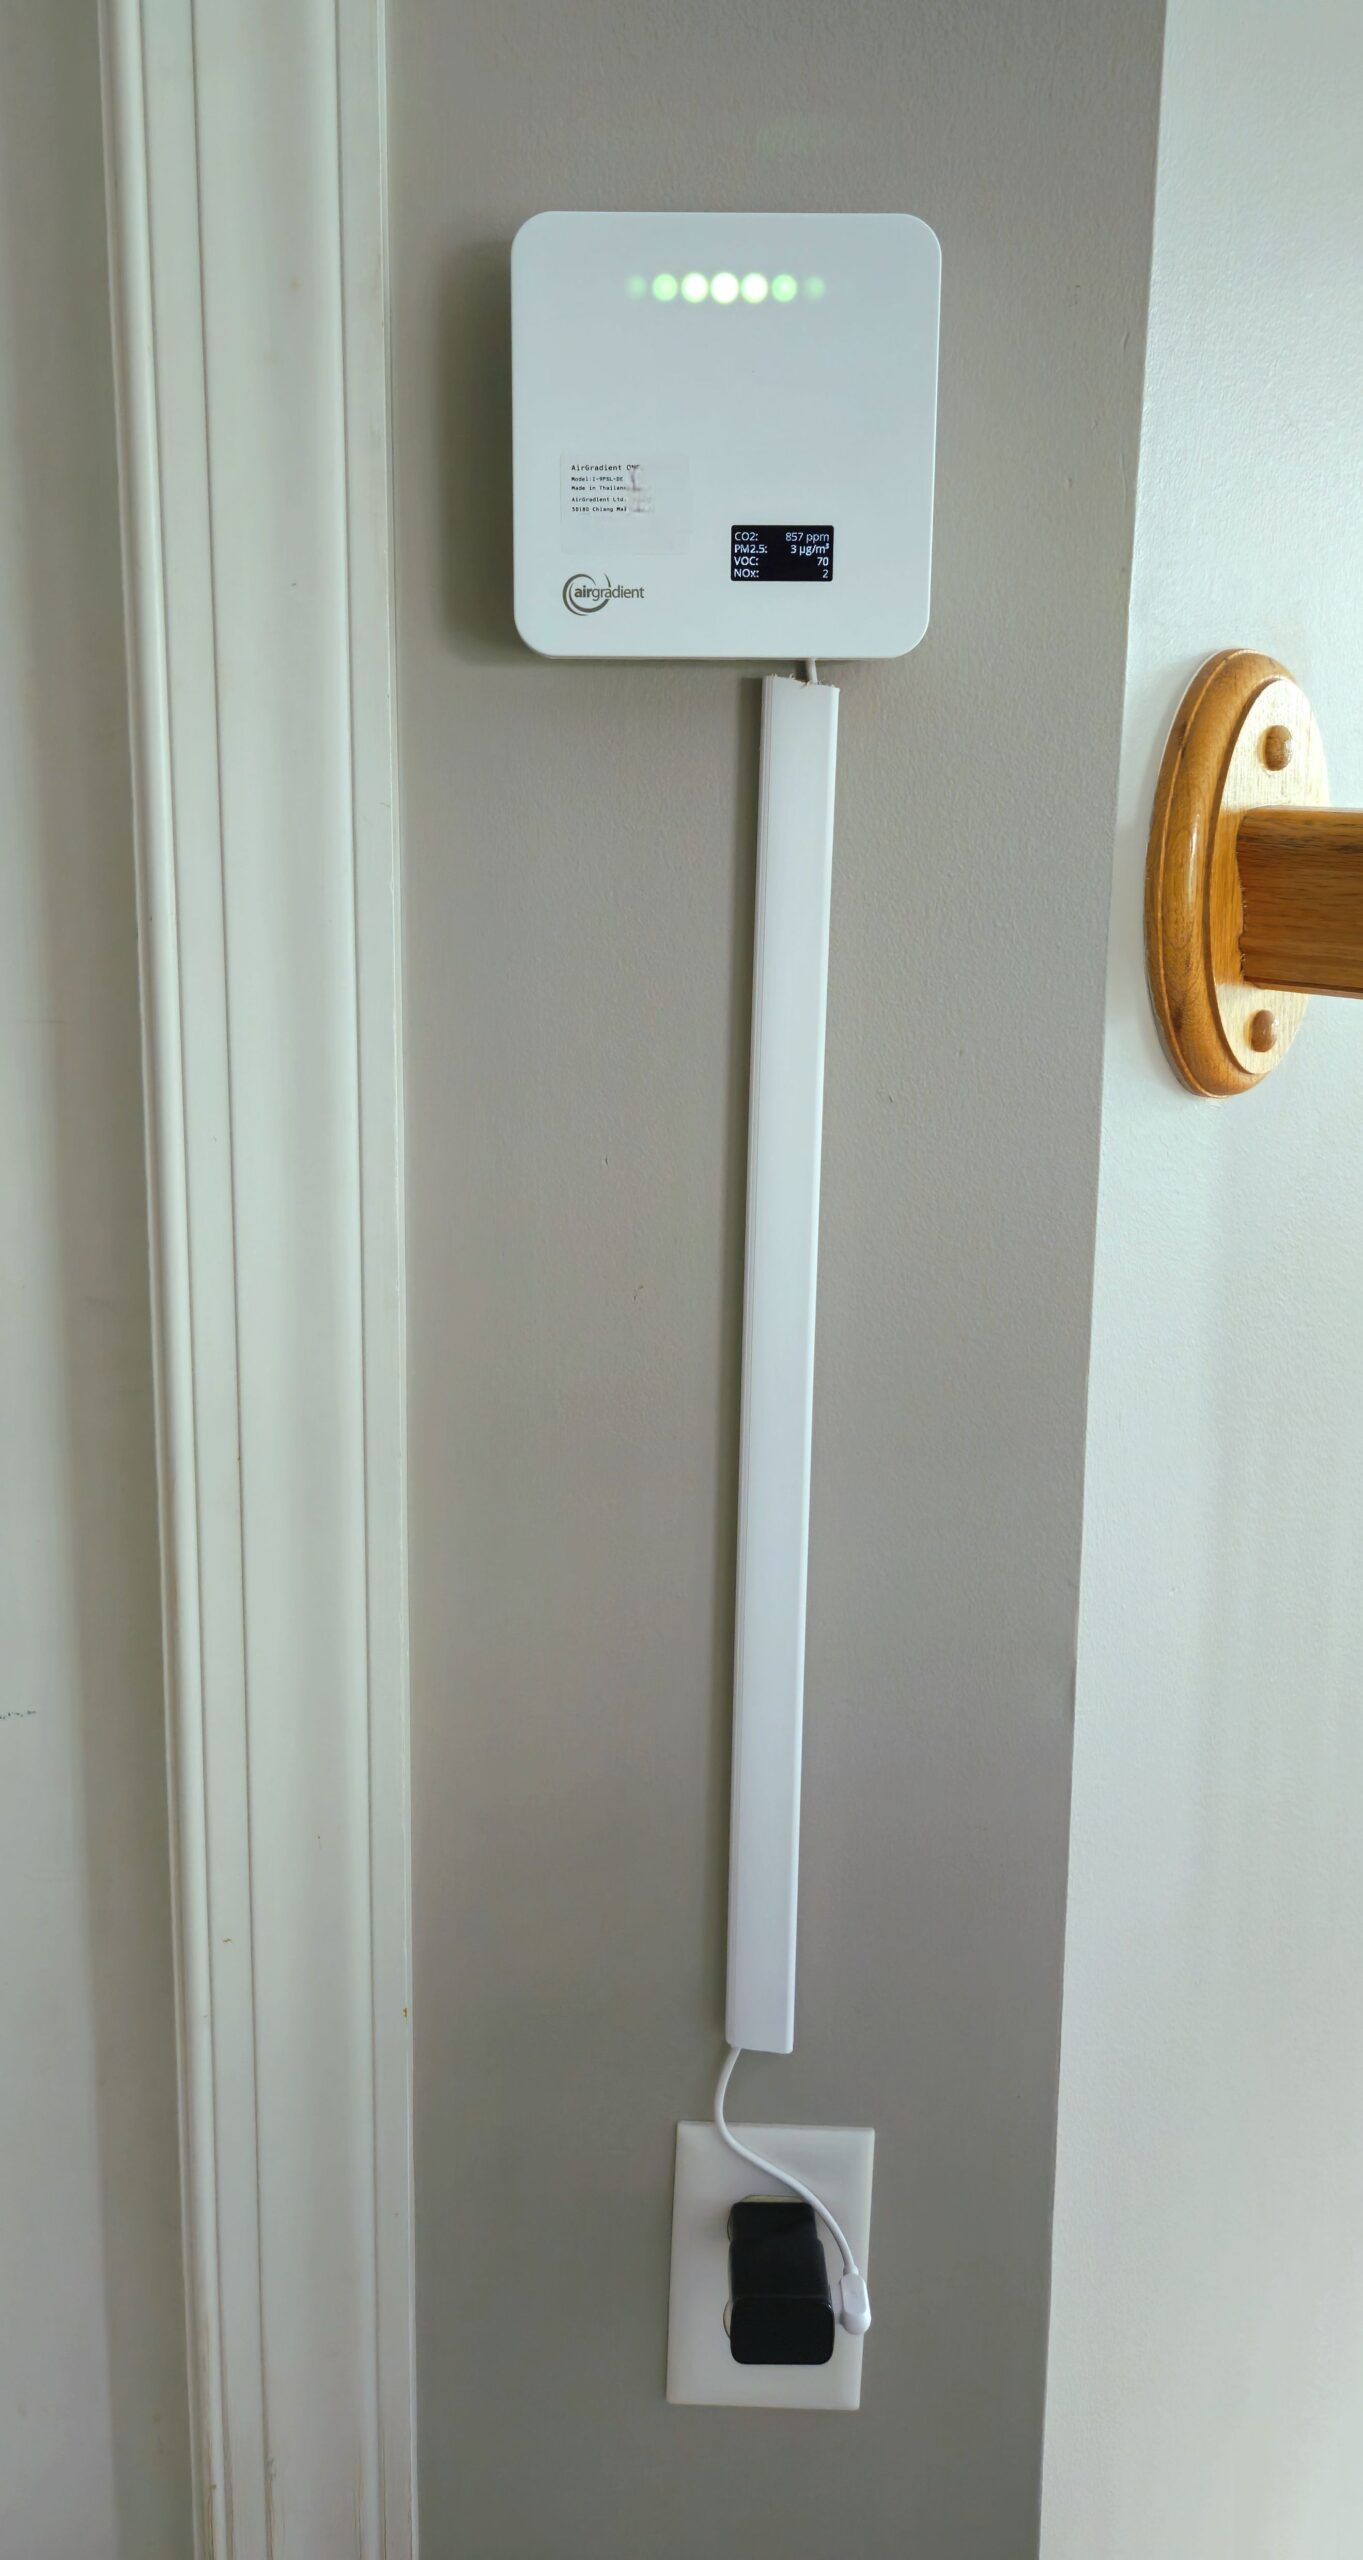
I selected the AirGradient monitors for a few reasons. First, the AirGradient models trade up the additional PM sensor in favor of other sensors, which help to measure TVOCs (Total Volatile Organic Compounds – Think the things which produce smells) and NOx (Nitric Oxide and Nitrogen Dioxide – Think the product of burning fuels). This is in addition to measuring Temperature, Humidity, and PM particles (0.3, 1.0, 2.5, and 10). The other reason I selected the AirGradient devices is because they are based on the popular ESP32-S3, which allows me to use the official AirGradient firmware, or re-flash the products easily to run the open source ESPHome firmware, or any other ESP-compatible firmware. The indoor AirGradient One hardware sports an OLED Display, which allows for the monitor to display the measured values, in addition to an RGB LED bar which can quickly display air quality information. The hardware is also a bit less expensive than the PurpleAir indoor hardware. Finally, AirGradient marketed the device as being open source, from the hardware to the software, and they stand by this with Schematics and Assembly instructions, as well as a GitHub Repository.
At the time of purchasing my air quality monitors, the hardware supported pushing data to the AirGradient Cloud, and supported providing data through MQTT by means of an MQTT Broker like Mosquito MQTT. Since the purchase of my hardware, AirGradient now has an official Home Assistant Integration, and a Homey Integration for retrieving data directly from the monitor. All of these options utilize a local API exposed by the device, without touching the Internet. See why this is a good idea to have!
The Purchasing Experience
I was a bit hesitant to try out AirGradient, as the company was fairly new, and there weren’t too many reviews on the monitors around the Internet. The market here is dominated by the likes of Google Nest, Amazon, Honeywell, and Ecobee, all of whom sell Air Quality Monitors in some way, shape or form, whether in a standalone unit or as part of a Thermostat. Hopefully this review helps to give AirGradient a bit more attention, and yet another much needed review of their products, so others can have some buying confidence.
When purchasing the monitors, AirGradient offered two options for purchase. The first option is the “DIY” avenue. They send you the product in a disassembled form for you to put together on your own using the assembly instructions on their website. They do this in exchange for a lower cost option to obtain the product. Alternatively, the monitor can be purchased as an assembled kit, lab tested by AirGradient (which also includes a one year warranty on the product), and shipped to you with a test report, for a slightly larger cost. This is similar to how Framework Laptops work, where you can order a “DIY” version of the product and bring (or order) your choice of SSD, RAM, and Wi-Fi card, or order everything all at once and have it delivered in an assembled form.
The products ship from Thailand, so be sure to pay for the monitors using a Credit Card which does not have Foreign Currency or Transaction Fees, and expect a week or two for shipping to occur. If you’re in the United States, expect to also pay a Tariff-related increase for these products on checkout (as of this writing). When I purchased my monitors, the United States did not have such extreme Tariff measures on the monitors, which allowed for the cost of my monitors to be under $200 per unit and made import duties significantly less.
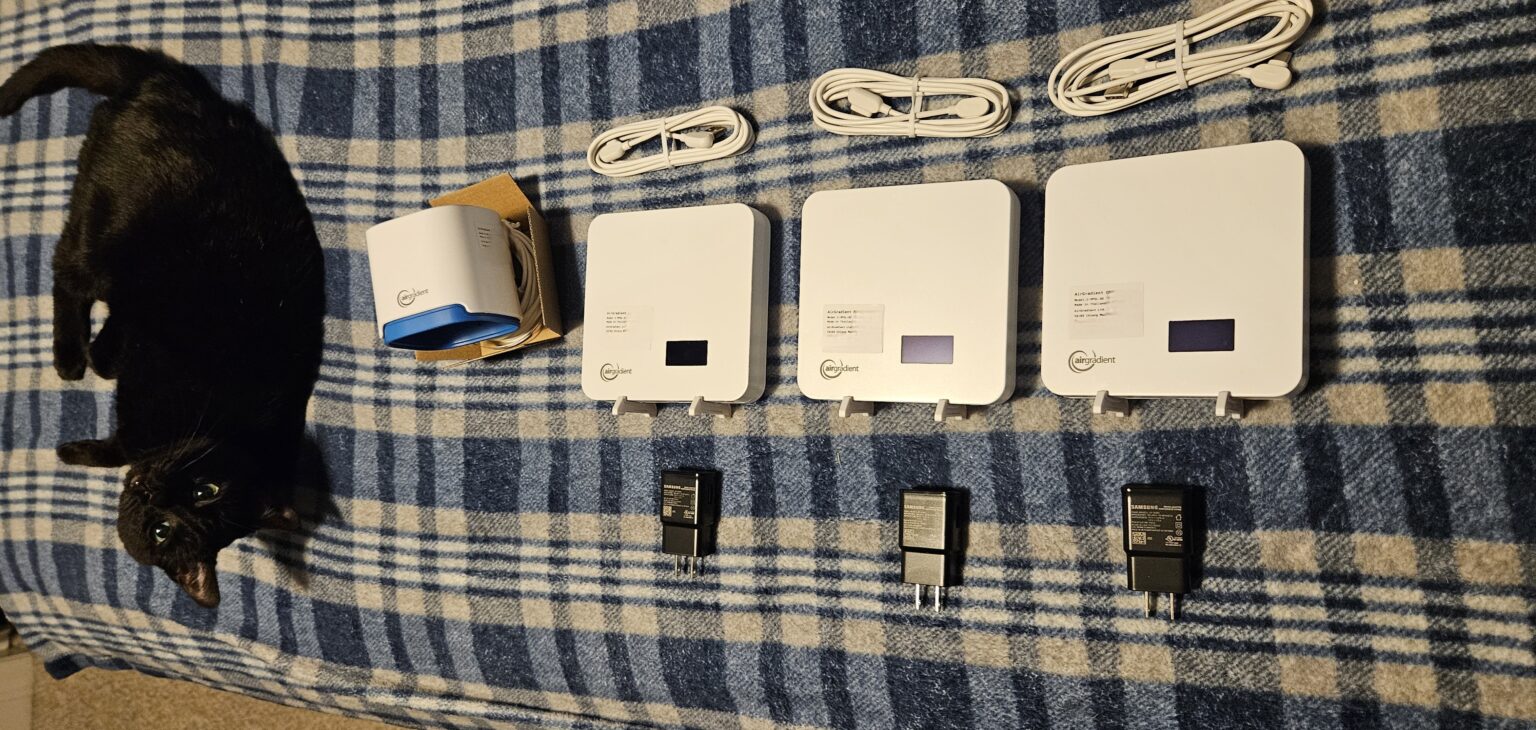
I purchased 3x of the Indoor Air Quality Monitors (AirGradient ONE), and 1x of the Outdoor Air Quality Monitor (AirGradient Open Air). Each indoor monitor is to cover one floor, which I’ll talk more about later on.
Initial Setup
The monitors arrived in a well packaged box, and included a copy of the Test Report from AirGradient, Assembly Date, and information on the product such as the MAC Address. In the box were the monitors and any necessary mounting hardware (Metal zip-ties for pole mounting of the outdoor monitor, and feet for the Indoor monitors if you choose not to use the built-in wall mounting holes). A USB-C to USB-A Cable was also included for each monitor, but no power supply. For a Power Supply, you simply need a 5v USB-A charger which is capable of outputting at least 1000ma (1 Amp), although 2 Amps are recommended for the monitors to work without browning out (which can cause inaccurate readings or boot loops).
Each monitor shipped with the latest “Factory” image of the AirGradient Firmware installed. After connecting each monitor to a Power Supply, each Indoor monitor displayed a welcome screen indicating the firmware of the product, and then switched to a countdown indicating how long the product’s Hotspot will be active. The outdoor monitor flashes a blue LED which indicates the monitor is operating a hotspot. Each monitor will operate the hotspot for 300 seconds, and then shut down the hotspot if no Wi-Fi connection is made to the device. The Air Quality Monitor will appear on the list of available Wi-Fi networks in the form of “AirGradient-XXXX” where the ending characters contain a portion of the device’s Wi-Fi MAC Address. Each device uses an encrypted Wi-Fi connection, with the password of “cleanair”. Each monitor also contained a sticker, which could be affixed to the monitor to display the hardware MAC address for future reference.
After using a Wi-Fi enabled device to connect to the AirGradient monitor, I simply visited the IP address of 192.168.4.1 using a web browser. This web page provides the Wi-FI connection menu, as well as a checkbox for enabling or disabling connectivity to the AirGradient Cloud (Yes, the device can be made “Local Only so it does not push any data to the Internet, before you even connect it to a network). To my surprise, the AirGradient devices support WPA3-PSK Wi-Fi networks, which is a great thing to see in an IoT device. Now, at the time of purchasing my monitors, they did not have a checkbox to disable uploading data to the Cloud. Newer firmware released within the past year has this option, and also has a boot-time toggle you can enable using the Reset/Programming button on the device. The monitors will show a message along the lines of “Press to disable cloud upload” or something along those lines during boot, which can be used after connecting the device to Wi-Fi, just in case you change your mind on this setting later.
After connecting the monitors to the Wi-Fi and enabling push to Cloud, each monitor installed a firmware update, and began performing their jobs. The last step was to enroll into the AirGradient Cloud with an account, and add each monitor via the MAC Address to the account. That was it!
The AirGradient Dashboard
The AirGradient Dashboard is pretty intuitive, and over the past year, I have seen them continuously add features to the web application, and refine it with more clarity. The Dashboard for AirGradient is available here.
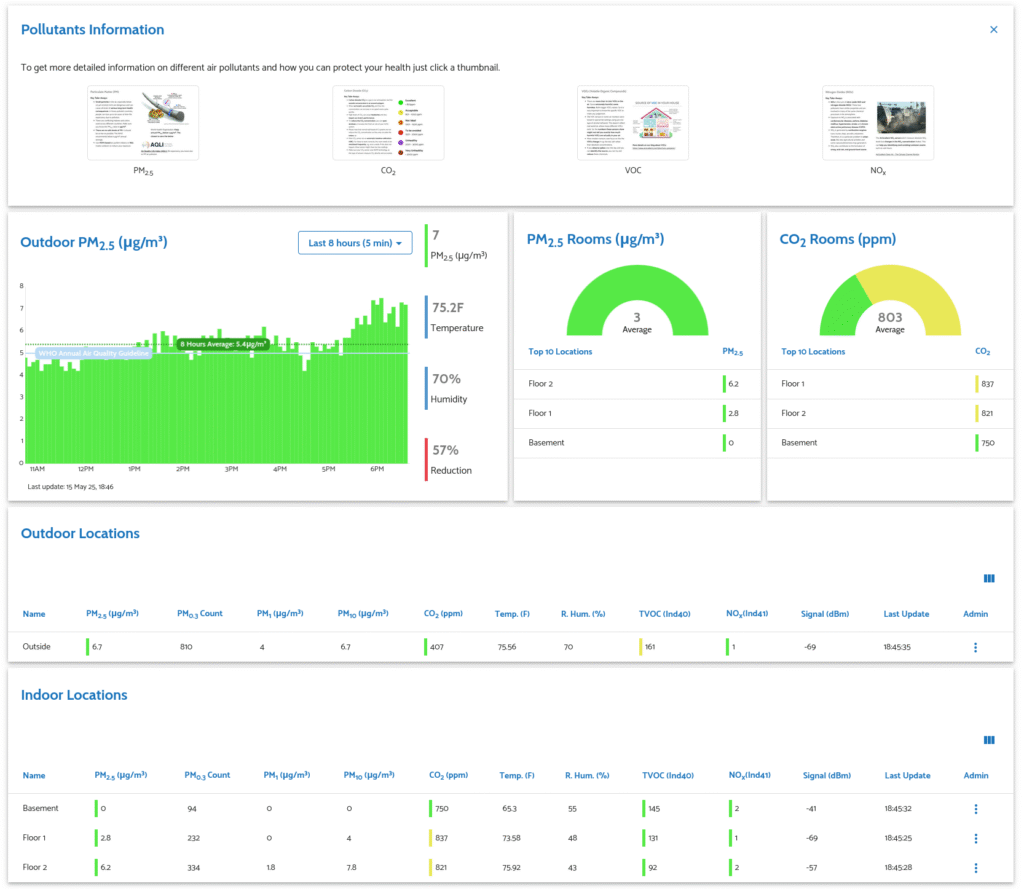
The Home Dashboard provides an overview of what your monitors are recording, and allows you to view historical data from the monitor. In my example, you’ll see each monitor is recording the PM2.5, PM0.3, PM1, PM10, CO2, Temperature, Relative Humidity, TVOCs, and NOx Air Quality information. Some other informative information such as the Wi-Fi signal, and the Last Update time are recorded to show the health of the Monitor. In the “Hardware” section of the Dashboard, additional information is available, such as the Uptime of the monitor, whether the Firmware is up to date, when the monitor was commissioned, and the MAC Address.
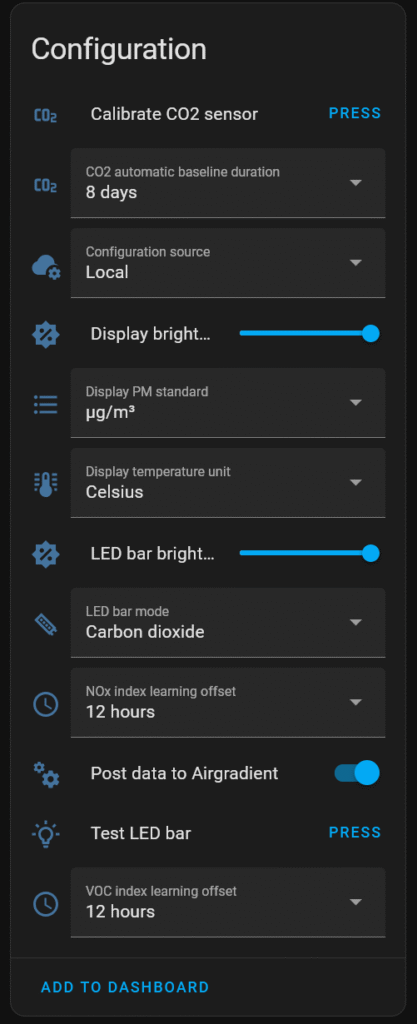
In the Dashboard, you can customize settings on the monitors such as whether the monitors automatically update their firmware, what the LEDs on the Indoor monitors display (currently, this can be toggled between CO2 and PM2.5 Levels, or turned off entirely. Day/Night Settings are also available for controlling whether the internal displays are on or not, and the brightness of the display and LEDs. You can also adjust how often the monitors perform Baseline Calibration, which is important as they can drift their results over time (more on that later). The units they measure can also be adjusted.
The Dashboard also provides options for Outdoor monitors to push this data to Public Data Sources such as OpenAQ, IQAir, and the AirGradient Map. This option allows the public to see your outdoor Air Quality data, and is handled through the AirGradient Cloud. Pushing data to these services is as simple as assigning a Geographic location to the monitor (via Longitude and Latitude), and enabling options for Third Party Data pushes (as seen below).

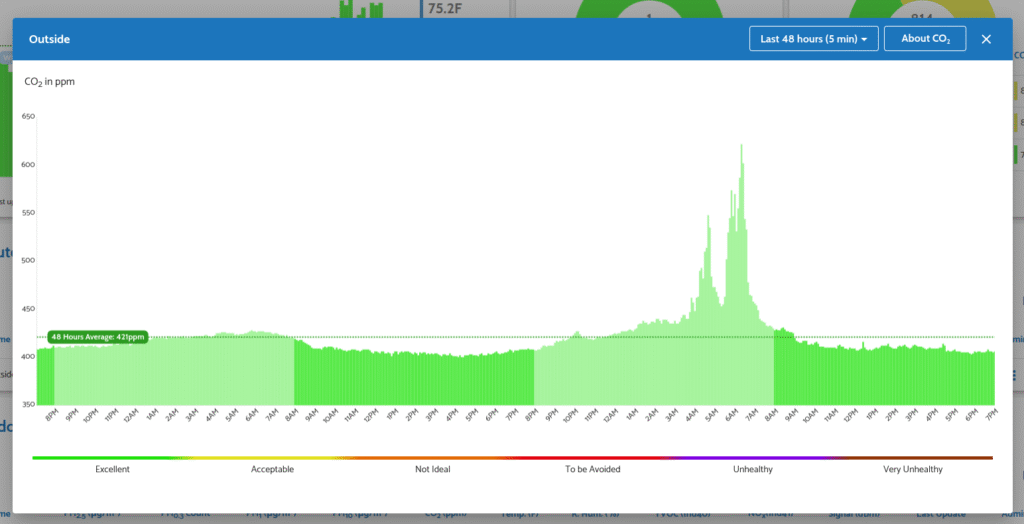
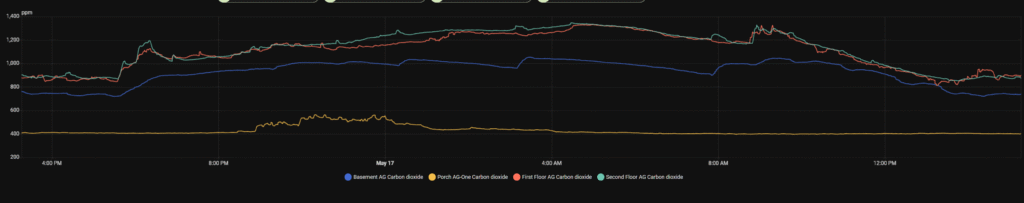
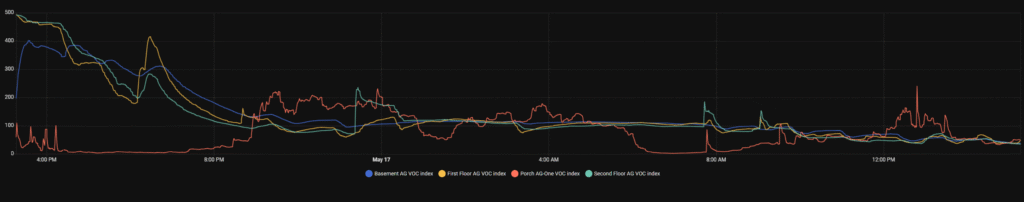
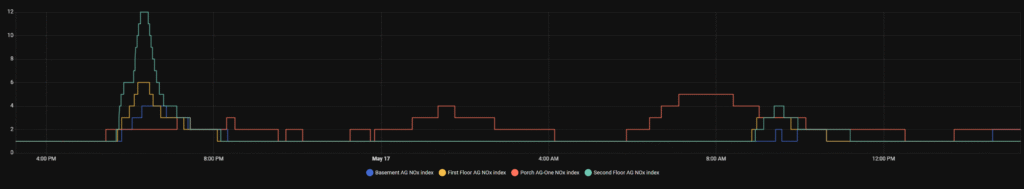
The historical data available looks similar to what is below. The data is pretty insightful, and the monitors report data approximately every minute.
The AirGradient Cloud Service also provides a few other features, such as the ability to configure alarms for the monitors. For example, if CO2 levels or if Temperature go outside of an “acceptable range” then the service can notify you via e-mail. The service also notifies you by default if an Air Quality Monitor goes offline for too long, and I get these when my Internet provider or Electric utility is having an outage lasting longer than five minutes.
The Cloud Service is touted to be free for users for the first 1-2 years before payment is needed to use it at a Premium level. I am not sure off hand what features will be lost if I choose not to pay for it, but it’s worth mentioning for the time being. Now, in terms of service reliability, when I first received the monitors, the Cloud Service had a few hiccups which would cause the monitors to lose connection, and eventually reboot themselves. Things have since stabilized, and firmware improvements have eliminated the reboots from occurring just because of a brief hiccup. I have also noticed the data push for third party services occasionally breaks, but this may be due to API Communication issues between a third party and AirGradient.
ESPHome and Home Assistant
Remember how I mentioned these Air Quality Monitors run the ESP32-S3 Micro-controller, and are open source devices? This is where we get to tinker a bit. Shortly after receiving my monitors, I worked to Integrate them into Home Assistant, as I use that software for home automation, monitoring, and control. As AirGradient at the time lacked a solid Home Assistant integration, instead relying on MQTT, I decided to flash the monitors to run the ESPHome firmware.
Flashing ESPHome was trivial, and I used the work of MallocArray on Github to get my monitors on ESPHome. To flash the monitors, I used a Chromium-based browser (Edge or Google Chrome) supporting WebSerial, and connected the monitors to a computer via USB. I placed each monitor into “Programing” or “Download” mode by holding down the Reset button on the monitor while making the USB connection. Once the USB connection was made, I used the pre-compiled binary provided by MallocArray and the ESPHome Web flashing tool to perform an “Install” of the binary for the monitor I was running. The flashing process took seconds, and after rebooting the monitor, I re-connected the product in the same manner as before – Connect to the Hotspot, visit 192.168.4.1, and enter in my Wi-Fi Credentials. After the hardware appeared on my Wi-Fi network, the ESPHome Install on my Home Assistant server picked up on the hardware, and could then be Adopted and modified via the YAML Config.
For those who don’t want to use the pre-compiled binaries and desire to do things like secure the OTA updates, name the device, modify how the sensors report to Home Assistant, and configure API Encryption, or even bake-in the Wi-Fi credentials off the bat, then MallocArray provides example YAML files in the GitHub Repository to get you started. All you have to do is take the contents of the YAML files from GitHub for your specific monitor, add a new device into your ESPHome install, and make the needed customization. Afterwards, you can have your ESPHome install build a binary for you to flash over WebSerial. I won’t go into the weeds too much about things you may need to change, but I’ll talk about some of the tweaks I needed to make later, as I did encounter one or two problems.
After installing ESPHome firmware and customizing my monitors, adding the monitors into Home Assistant was as simple as going to Home Assistant –> Settings –> Devices –> Add Device –> ESPHome, entering in the IP address of my device, and entering in the API Encryption key for the specific monitor I configured into the ESP firmware. Auto Detection also works, as the monitors identify themselves over mDNS, although if you have an IoT Network which is heavily policed, then discovery may not work.
The monitors populate each sensor into Home Assistant as an Entity, and some additional entities for the device’s uptime and Wi-Fi Signal are also available for diagnostic purposes. Entities for adjusting the display and LED brightness on the Indoor units are also made available for use with automation scripts. Finally, a toggle to enable or disable uploading data to AirGradient is available. On the ESPHome side of things, the monitors are also viewable through a built-in Web Interface, and other options such as the Bluetooth Proxy can be enabled on the Air Quality Monitor for use as an iBeacon Tracker, or as a Bluetooth Bridge for nearby proxies – However, in my personal experience, enabling this feature required stripping down the firmware of useful features like the Captive Portal, due to the available Flash on the ESP. I also experienced Wi-Fi Connectivity issues caused by the Wi-Fi on the ESP needing to be set to use Power Save mode, as part of Bluetooth Coexistance mechanisms.
The AirGradient Home Assistant Integration
In more recent history, I switched my air quality monitors from ESPHome over to the AirGradient official firmware, following a series of enhancements to the software, as well as Home Assistant now having a native integration that is not reliant on MQTT. Switching from ESPHome to AirGradient was as simple as the switch from AirGradient to ESPHome, via USB and a Web Serial connection.
With the new Home Assistant Integration, you can choose whether to manage your AirGradient device settings via the AirGradient Cloud, or to let Home Assistant manage it. The same data provided under ESPHome is available, along with a few other options one can enable in ESPHome via the YAML configuration.
A heads-up…
This is probably a good time to point out something which occurs under both the AirGradient firmware, and the ESPHome firmware I used. Notice the settings for CO2 Sensor Calibration? This establishes a “baseline” for the monitor, by setting the current reading to be a value of 400, similar to how “TARE” on a Scale works to zero out the scale prior to weighing.
The monitors by default will perform a baseline calibration at once a week, and when they calibrate, they do this based on the lowest CO2 value read since the monitor last calibrated (or last rebooted…). This is because the CO2 sensors can drift over time and begin to lose accuracy. This is the drawback of inexpensive monitoring hardware. This calibration period can be disabled if you like, or performed more or less frequently. What this also means is your air quality monitors, especially air quality monitors indoors receiving less fresh air supply, will become inaccurate over time as they “zero” themselves to a new baseline level.
A way to tell if your air quality monitor has become inaccurate indoors, is to open some windows on a nice day. If you see the CO2 levels record lower than 400, then you need to allow things to air out further before pressing the calibrate button manually. Alternatively, you can script this.
There are also VOC and NOx Learning Offsets. This is taking the raw NOx and VOC data from the sensors and applying a measurement algorithm to them in order to detect increases and changes. This also means that unless your monitor is getting a fresh supply of air, in time, these readings can become less insightful.
So realistically: Keep a fresh supply of air moving through regularly for accurate results. Fresh air will help immensely.
A few minor problems
Setting up the monitors and using them has been pretty straight forward. They have not been without some minor problems, most of which are pet-peeves, and one or two which were due to software bugs.
The first issue I encountered with the monitors was within the first week or two of operation. I used the AirGradient firmware initially to proof the devices and ensure they were working. AirGradient had a few issues with their Cloud service, which would cause the devices to enter a reboot loop normally within a few minutes of an outage. When the devices enter a reboot loop, they stop displaying Air Quality information via the Status LEDs and Display, and get stuck within a “Warm-up” state. When I eventually switched the monitors over to the ESPHome firmware, the same situation would occur whenever the monitors couldn’t push data to the AirGradient cloud. This issue could be resolved on the ESPHome side by disabling the “Upload to AirGradient” Entity option (not the entity itself) within Home Assistant. It could also be resolved by modifying some of the YAML configuration centered around the hardware Watchdog. More on this is detailed in a GitHub Problem report. AirGradient also released an official Firmware upgrade for this several months ago, so the monitors should continue to work even while the Cloud connectivity is not working.
The second issue I encountered with the monitors, happens with both the AirGradient firmware, and ESPHome, but especially the AirGradient firmware. Because I live in a home which has Wi-Fi service delivered via four Ubiquiti U6 Access points, the Air Quality Monitors often like to settle on a single access point following a reboot, even if there is an access point with a stronger signal nearby. The AirGradient firmware seems to scan for access points by name starting on 2.4Ghz Channel 1, and ending at Channel 11, and as you might have guessed just now, the Air Quality monitors will typically connect to the access point broadcasting on Channel 1. In time, whether due to de-authenticating or due to firmware updates on my access points, the devices will spread themselves across the access points. his behavior is particularly annoying, as although the Air Quality monitors are not chatty devices, connecting to a far away AP results in slower network connectivity for the monitor, and this ties up the radio for other devices which can talk faster, thus slowing down the wireless network. In ESPHome, I can typically resolve this by disabling the “fast_connect” option, and enabling the “passive_scan” option in my YAML Configuration file.
The third issue has boiled down to Wi-Fi stability, but only in ESPHome. The problem is pretty straight-forward. If ESPHome allows the Wi-Fi chipset to enter Power Save mode, the ESP will see wildly varying latency / ping times, and I’ll begin to encounter issues with things like performing OTA Firmware updates, and access issues to the ESP. This issue can be resolved by setting the power_save_mode option in the ESPHome YAML config to “none” which has resulted in excellent wireless performance for the monitor. Note that this option cannot be set to “none” if you are making use of the Air Quality Monitor as a Bluetooth proxy… not that I recommend doing that in the first place due to RAM Limitations on the hardware.
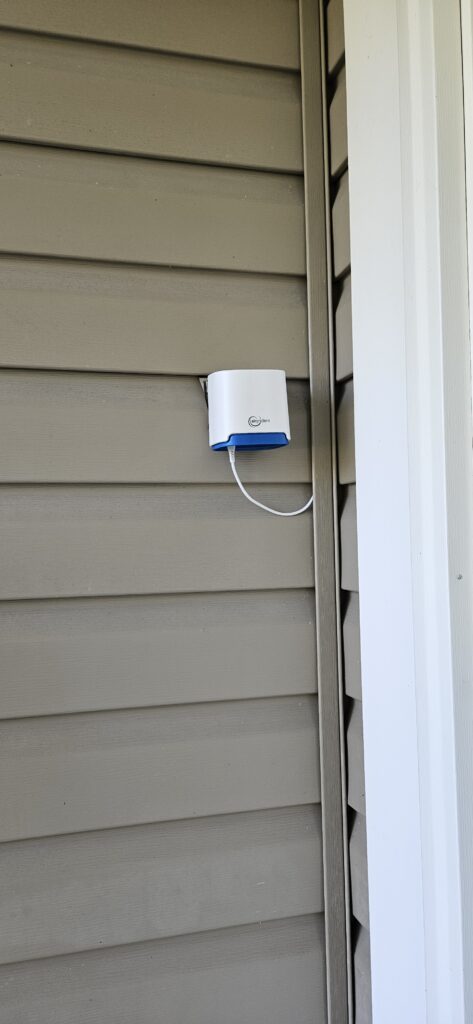
The fourth issue was specific to the outdoor Air Quality monitor. AirGradient did not have recommendations on, or offer a power supply suitable for outdoor use. For this I needed to do a bit of homework. The Air Quality Monitor ships with a reasonably long USB-C to USB-A power cable. Using the monitor outdoors requires some work to ensure rain and other moisture does not get into the electrical connections. To waterproof the connection to the monitor itself, I used a bit of Dielectric Silicone Grease in the USB port. For the power supply, I had a few choices to consider. I could go with a Weather Resistant outdoor supply used by consumer security camera products, such as this Ring power supply (non-affiliate Amazon Link), change one of my outdoor electrical outlets to one with a USB-A connection, drill through the house and use caulk to seal up the hole, connecting the device via an inside outlet, or place a small USB-A charger inside of a Weather-Resistant Electric box. In my situation, given the air quality monitor is installed under an overhang, along with the outlet, and I already have a Weather-Resistant box in place, I ended up using a standard Apple USB-A Charger that I had laying around (5V 1A). This has worked well for about a year, and the charger has not given any issues with the wild weather swings we experience in the area. My Indoor Air Quality Monitors, on that note, are using Samsung QC 2.0 chargers which can output at 5V 2A.
Some general observations
After having about a year of time spent with the monitors, the data gleaned from them has been a bit on the surprising side! For example, I did not realize just how much CO2 levels rise inside of a house when the windows are closed. Assuming a CO2 level of “400ppm” is atmospheric as per AirGradient’s baseline calibration standard, I can watch my home’s CO2 levels increase with a large family and some house plants on summer days when the windows are closed, and drop slowly when no one is home. A CO2 level rise is more dramatic if a gas stove is used and the hood vent isn’t able to keep up or if parties are happening. I have also noticed a curious rise in CO2 levels outside during the night when it is summer, reaching levels of around 1,200, and then rapidly dropping after 5AM when the sun rises. This tells me about how plants undergo the Carbon cycle, and release Carbon Dioxide at night during cellular respiration, and how fast Photosynthesis processes kick in to produce oxygen once the sun starts to rise. This is also likely a product of Carbon Dioxide being a heavier gas than simple Oxygen, so the effects of higher CO2 levels in the atmosphere are compounded by temperature, as molecules expand and contract. I have also been able to glean the effects windy days have on the air quality inside and outside of the house, with CO2 levels often being lower on those days. Curiously, I have noticed that CO2 levels remain pretty steady during the winter (although it is often breezy all winter here) both inside and out.
In addition to CO2 levels, what has been more insightful are the temperature readings for each floor of my house. Now, for those who read this blog, you might know that I have a Nest Thermostat. One of the things the Nest Thermostat can do is pair up with Nest sensors in order to measure the temperature elsewhere in the house, and adjust the HVAC controls accordingly to help improve comfort in more remote zones of the house. I don’t have any Nest Sensors, but I do have Home Assistant and these Air Quality Monitors. I realized, at any given day, there is at least a 2-5F temperature difference between my second floor, and my first floor, and then another similar temperature difference between my first floor and basement. This sort of data has helped with using air circulation in the house to balance temperature in a smart way with Home Assistant, and has also provided other insights on how much radiant heat comes from my home’s attic on hot summer days, which makes getting to bed at night incredibly uncomfortable! Not to mention, causes a lot of extra energy usage trying to keep the house comfortable.
Another insightful detail has actually helped with avoiding otherwise frequent headaches I used to have around busy holidays like Thanksgiving, and Christmas, where we find ourselves doing a lot of cooking. Not that we don’t cook a lot during the summer, it’s just that we are able to do a lot of the summer time cooking outside on the grill, and we often eat more fruits and vegetables while they are in season (and therefore very fresh). My home has a Natural Gas cooking range (four burner), along with a propane Grill (outside). Part of the cooking range also includes a power vent with a grease trap, which captures grease-filled air (important for fire risk reduction and personal health), and the power vent is meant to draw out the harmful byproducts of burning natural gas indoors. I have realized that even with the power vent, the vent is not drawing a sufficient amount of air out of the house whenever we are using all four burners at maximum heat. This cases a rise in NOx, CO2, PM levels, and VOCs in the house, and has explained why I’d often end up tired and with a headache following a Thanksgiving meal (it was not the Turkey after all!) when the stove might be running for a few hours at a time. Even for day to day meals, despite the vent seemingly having enough airflow for two burners, it still doesn’t capture everything, such as when cooking oils burn into a smokey mess.

What I have also come to realize is that MERV13 Air Filtration has been wonderful to have at home. On the days where we are not cooking food at home with the stove, the air quality inside often exceeds that of the outside with the exception of CO2. PM2.5 levels can be exceptionally high outdoors, such as when we are having another smoke-filled day from nearby wild fires, while indoor PM2.5 levels barely register on the charts. You can smell the difference between outside and filtered inside air when this happens.
Improvements?
Where I think AirGradient could expand / improve upon the products is with Carbon Monoxide monitoring, as well as Radon monitoring. Here’s why.
An air quality monitor like this is no replacement to having dedicated Carbon Monoxide monitoring devices at home. The same goes with such a monitor being no replacement for having Hardwired Smoke Detectors with Carbon Monoxide monitoring that can trigger every alarm to go off in the house, as is required by Residential building code in my area. However, it would be nice to have these monitors record CO levels, for recordkeeping purposes, and to provide additional insight on the actual air quality in a home. I’d lover to know if my Gas Dryer or Gas Furnace has an issue whereby gas isn’t being fully burnt and expelled out of the house via the exhaust vent. I’d also love to know if there is a very slow gas leak in the house that hasn’t been sufficient to trigger my Carbon Monoxide alarms.
The same goes for Radon detection. Radon is radioactive gas, and is naturally occurring radioactivity that originates from ground sources. My area is known to have higher levels of Radon, and some homes are built upon dense deposits of Radon which require specialized Radon ventilation to be installed so it does not seep through the foundation and build up within a home. Likewise, poor ventilation can lead to a build-up of Radon gas in a basement if Radon happens to be present in the ground.
AirGradient did leave one or two GPIO headers available in my monitors for adding these kinds of sensors, and I believe there is room for such sensors in the case. Besides purchasing a sensor which can be attached to the ESP32, I would need to add in the code and components into ESPHome firmware to read this information. Or, fork the AirGradient ESP firmware, and add in the required code to read the new sensor data.
Additionally, I would love to see AirGradient include more control over the LEDs. ESPHome provides pretty granular LED control, as each LED in the LED strip is able to be addressed in code. Their default firmware allows you to show only CO2 or Particle counts via Color and an intensity bar (which is inverted, by the way, from right to left, rather than left to right). I would love to be able to change the bar to allocate three LEDs towards CO2, three LEDs towards NOx, three LEDs towards VOCs, and a remaining LED for showing Wi-Fi signal health. This allows for a quick glance from across a room if you’re too far to read the screen on the indoor monitor. Additionally, the outdoor monitor does not occasionally flash the blue LED to indicate it is alive, so I would love to see some “Sign of life” controls for the outdoor monitor. The blue light typically only turns on while the device is booting and looing for Wi-Fi.
Conclusion
Do I recommend buying an air quality monitor? Sure do. Do I recommend the AirGradient monitors? Of course. I expect to have a long service life out of the hardware, and because the kit is open source with known sensors, replacement of parts as they age out is rather trivial. Although I briefly touched on some of the insightful data I’ve received from the monitors, I feel as though having them has helped me understand and improve the health of my family, and at the same time, help to increase awareness around opening the windows for fresh air, even in the middle of winter, and the importance of spending a bit more money on filtration, or the importance of running a hood vent when cooking. The data has helped to fix a lot of bad habits around the house.
This sort of device has also provided some insights on some other information I’ve learned about over the years. Such as why newer homes allow some air leakage to occur versus being fully airtight, and why even newer homes have negative pressure relief ducts on the basement floors to allow for fresh air circulation to occur naturally (some for the stove, some for the dryer, etc).
To wrap up, here are some installation photos 🙂